Graphing Lesson & Reflection
Name: Britany Lynch
Lesson Title: Graphing
Grade level(s)/Course: 2nd Grade
Date taught: December 5th, 2012
GENERAL CONTEXT
District, school or cooperating teacher requirement or expectations that might influence your planning or delivery of instruction.
My cooperating teacher asked me to create a Smartboard activity where students would graph the answers to questions.
INFORMATION ABOUT THE LESSON
Content Strand – found within the Wisconsin Academic Content Standards
2. MD.10-Draw a picture graph and a bar graph (with single-unit scale) to represent a data set with up to four categories. Solve simple put together, take-apart, and compare problems using information presented in a bar graph.
Enduring Understanding and/or Essential Question
What is a bar graph?
What information did you learn from the graph?
What can you use a bar graph for?
Outcome(s)
Students will be able to create a bar graph from the data gathered as a class. They will also be able to explain what they learned from the information on the graph.
Academic Language related to the lesson
Bar graph
Title
Data
Prior Learning/Prior Thinking
Students have a little experience with graphing. They were introduced to graphing earlier in the week by the teacher.
LESSON IMPLEMENTATION
Anticipatory Set/Elicit Prior Knowledge
To get the student’s interested in the lesson, I will ask them if they have ever seen a graph before and show them an example of the kind of graph we will be creating that day.
Focus/Purpose Statement
The purpose of this lesson is to learn how to make a bar graph and use the information that we learned from reading the graph.
Procedures
1. First we will talk about what a bar graph is, and what the different parts of the graph are. We will also discuss why we need those parts.
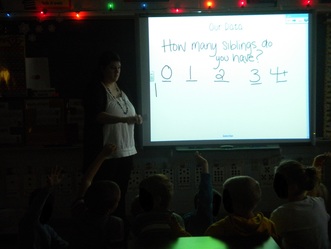
2. We will then collect our data by having students raise their hands to the question how many siblings do you have?
3.Then as a group we will construct a bar graph as a group.
4.Students will then copy the bar graph on provided sheets so they have a copy of their own to look at while talking about the graph.
5.We will then find at least two things that the students learned from the graphs.
a. Ex:Which category had the most?
6. We will also create equations if applicable to what we learned.
a. Ex: 3 siblings had 2 more people than 1 sibling
i. 4-2=2
Closure
To close the students will be asked to come up with one thing on their own that they learned from the graph.
Materials and Resources
Smartboard activity
Graphs for students to fill in
Classroom Management/Democratic Practices
To promote a democratic classroom, each student will be able to answer the chosen question. They will also be able to discuss with their tables what they learned from the graph or graphs.
ASSESSMENT
Before the lesson
Before starting the lesson I will ask students if they have ever seen a bar graph or line graph before, and if they have ever created a graph themselves.
During the lesson
During the lesson I will observe student behavior to see they understand how to graph the information.
At the end of the lesson
As a final assessment we will discuss what the student’s learned from the graphs. They will name at least three things that they learned from the graphs and will create an equation if applicable.
Lesson Reflection
Preparing a Smartboard activity was more difficult than I had thought. I haven’t had a lot of experience with Smartboards and the students seemed to know more about it than I had. Even though I had some trouble with the Smartboard, the students really seemed to enjoy the activity.
When I started the lesson, the students were a little confused by my questions. For example, I told them that something was missing from the side of
the graph, and asked what they thought that thing was. They looked at me with very confused looks. That is when I rephrased my question and they knew
immediately what I was asking. It made me realized that I really need to think about how I ask questions and how I tell students things, because they may not understand what I am saying, and that is essential to the students learning.
One thing that the students really enjoyed was that the question was related to them. They were able to give their own input which created a sense of democracy in the classroom. Besides democracy it was something that the students could relate too. They are going to remember the information better because it related to them. This is one reason why I chose the question that I did. Having the students make their own graph after we created one as a group seemed really beneficial to the students.
While creating their own graph one student started coloring in the boxes horizontally instead of vertically. I assumed that since we created the graph as a group and the example was on the board that students would copy the information directly from the board. This made me realize that I can’t assume that students will know something. I must explain all directions clearly and accurately so students can learn what they need to.
In the end, I believe this lesson went very well. There were some difficulties with the Smartboard at first, but I got the hang of it after awhile. The students really seemed to enjoy my lesson and seemed to be engaged the whole time. The one thing that I learned from teaching this lesson is that I need to be clearer on my directions so that students can properly complete the activity and learn what they are supposed to from that activity.
